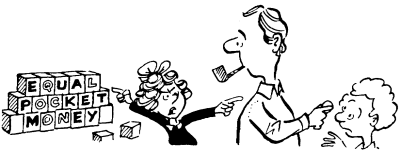
The Manageress
Food, Drink and Tobacco
Different Industries
|

|
Different Jobs
The Manageress
Our small firm in Table 2 also has a manageress. Her hourly
rate of pay is £3.70. She has more responsibility and gets a
higher wage.
For this firm, using Table 2:
- Find the mean pay rate for all the women,
including the manageress.
Compare this with the mean pay rate for the men.
The firm does keep the Equal Pay Act, but the women earn more,
on average, than the men. In most firms the average wage for men
is more than the average wage for women.
- Why is this so? Do you think it is fair?
Food, Drink and Tobacco
One way to make a fairer comparison is to look at one industry
and the workers in it. Some figures for workers in the food,
drink and tobacco industry are given in Table 8.
(Source: New Earnings Survey)
Table 8 - Quartiles of wage rates in the food, drink and tobacco
industry, 1977.
- Write down two or three sentences comparing the wage
rates of clerical men and clerical women. Use the figures
in Table 8 and the interquartile
range.
- Similarly, compare one other group of workers.
- Write down some reasons why men and women in the same
sort of job in the same industry may get different rates
of pay.
- *What other information would you need to decide whether
the Equal Pay Act is working?
*Different Industries
You may like to compare wages in different industries.
- Choose the women's or men's rates in one or two
industries from Table 9. This
includes only manual workers. Draw a cumulative
percentage graph; find the median and the interquartile
range.
(Source: New Earnings Survey)
Table 9 - Cumulative percentage of earnings of female manual
workers (men's in brackets), 1977
- Which of these industries would you like to work in?
- Do you think the Equal Pay Act has improved women's
wages?
|